As we move forward into 2022, it’s always good to reflect on the last year and how 2021’s moving trends might impact those in our current year. Especially if you’re looking to buy or rent a new home in 2022, the information provided in the forthcoming report can help you tackle the housing market in a more well-versed manner. So what did we find out about the moving trends in 2021? Let’s find out!
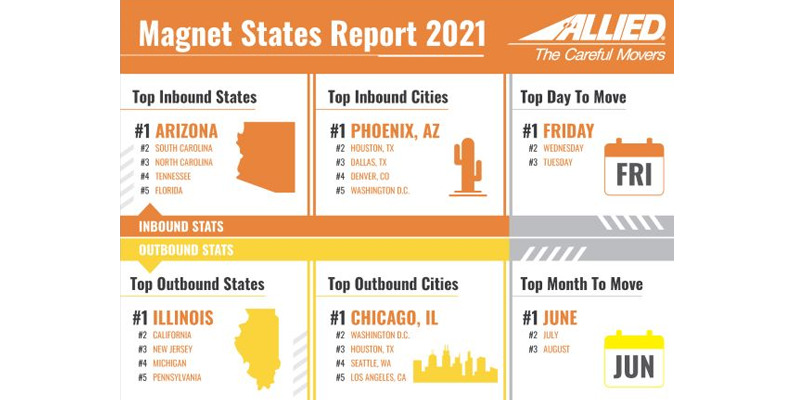
The 2021 Magnet States Report shows that consumers continue to flock to Florida, while people moving for work are going to Texas. The Magnet States Report analyzes moves by thousands of Allied customers and Zillow Home Value Index data from January 1, 2021 – November 14, 2021. Historical trends date back to January 1, 2016.
Top Destination States:
- Florida: 5, 684 moves
- Texas: 4,739 moves
- California: 3,253 moves
- North Carolina: 2,465 moves
- Arizona: 2,299 moves
Where People Moved to Most:
- Dallas- Fort Worth
Where People Moved Out of:
- Chicago
Moving Trends
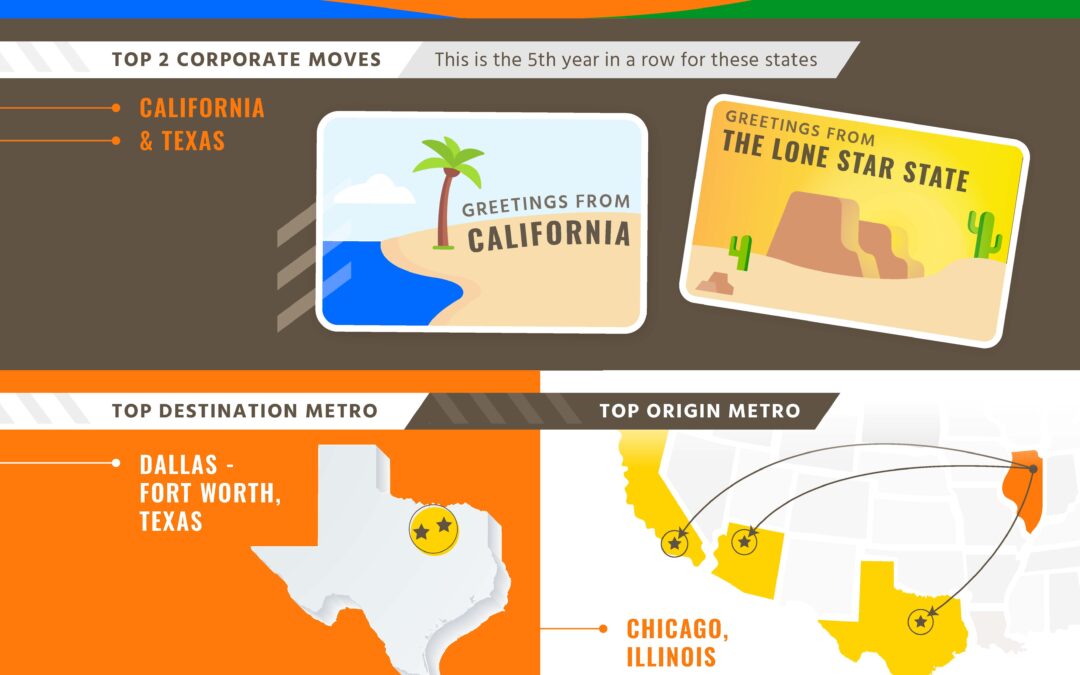
- A showdown to be the top state for business: for work-related moves, Texas (#1) and California (#2) are the top destination states for the last five years.
- The top destination market for all those who moved with Allied (corporate and consumer) was Dallas-Fort Worth and the place most people moved out of was Chicago, IL.
- The top destination cities for people who moved for work in 2021 were Houston, Tucson and Chicago.
- The top cities that people moved to for reasons other than work in 2021 were: Austin, Chicago and Denver.
- The top city Allied customers moved out of was Chicago for the fifth year in a row. Where did they go? Denver, Los Angeles, and Austin.
- The top day of the week for consumers to move was Wednesdays and during the summer months (June/July) hold strong as the peak moving season when kids are out of school, making it easier for families with children to move.
- The top day of the week for people to move for work has been Fridays for the last five years in the summer months, aligned with the peak moving season.

Housing Trends
- The average interstate mover in 2021 moved to a ZIP code where homes were about $35,800 cheaper than where they came from, amplifying a trend that first broke out in 2020, when movers began migrating from pricier to much more affordable locales.
- The comparable average ZIP-level price decline in 2020 was about $29,500. Before the pandemic, people tended to move to ZIP codes with very similar average prices: the average ZIP-level price change was only a decrease of less than $7,500 in each year from 2016 to 2019.
- The larger affordability gradient this year was driven by a remarkable rise in the average home value of people’s origin ZIP codes: it rose by 14.0%, to reach $480,736. But, reflecting the year’s hot housing market, the average value of homes in ZIP codes where interstate movers ended up in 2021 also rose substantially; by 13.5%, to $444,932.
- The top destinations for net inbound moves in 2021 are mid-priced growing Sunbelt metro areas, while the top origins for net outbound moves are in places that are colder, pricier, or both.
- The Dallas-Fort Worth metro area topped the rankings for the most net inbound moves in 2021, pulling in movers especially from pricey Los Angeles and chilly Chicago, as well as Phoenix.
- Chicago tops the list of metro areas that originated the most net outbound moves, sending the most movers south and west to Phoenix, Dallas-Fort Worth, and Los Angeles.
- Some of 2020’s top destinations have lost their affordability edge, and now they’re attracting fewer movers.
- In 2020, Phoenix had the most net inbound moves, and Austin had the fourth most, out of all metro areas. But in 2021, they slid to the eighth and 10th highest net destinations, respectively. That might be due to the declining number of movers experiencing large price savings, at the local level, when moving there this year.
- So far in 2021, people moving into the Austin metro area are moving from ZIP codes with an average home value of $632,779, and moving into ones in the Austin area where homes are worth an average of $608,163, for less than $25,000 of potential price savings. In the comparable data covering the same time frame in 2020, people moving to Austin saw ZIP-level price savings averaging over $140,000.
- This year, people moving into the Phoenix metro area are moving from ZIP codes with an average home value of $528,712, and moving into ones in the Phoenix area where homes are worth roughly the same: $526,993, on average, or only about $1,700 less. In the comparable data for 2020, people moving to Phoenix saw ZIP-level price savings averaging over $48,000.
- The diminished home price savings for people moving to Austin and Phoenix in 2021 reflects the likely effects of 2020’s demand surge, which drove up the cost of homes in those metro areas faster than in any other major metropolitan area, thereby potentially shrinking the pool of movers in 2021.
Just like in years past, people come and go from certain states, but the 2021 Magnet Report continues to show unprecedented moving patterns in relation to the COVID-19 pandemic, which are expected to continue into 2022.
Looking for the best movers for your 2022 relocation? Contact Excel Moving & Storage to see what we can do for you. Between our complete moving and storage services and customized packages truly tailored to you, PLUS unparalleled customer service, we’ll have you covered from start to finish.


